Market Outlook
November 16, 2017
Market Cues
Domestic Indices
Chg (%)
(Pts)
(Close)
Indian markets are likely to open flat tracking global indices and SGX Nifty.
BSE Sensex
(0.6)
(181)
32,760
U.S. stocks closed lower Wednesday, as falling oil prices and worries over the
Nifty
(0.7)
(69)
10,118
progress of a U.S. tax overhaul left investors increasingly averse to putting more
Mid Cap
(1.0)
(166)
16,329
money into assets seen as risky. Traders were also digesting the latest batch of U.S.
Small Cap
(1.5)
(266)
17,273
economic news, including a report from the Commerce Department showing a
Bankex
(0.3)
(81)
28,624
modest increase in retail sales in the month of October. The Dow ended the day
down by 0.6% at 23,271.The NASDAQ dropped 0.47% to close at 6,706 and the
S&P 500 fell 0.55% to finish at 2,564.
Global Indices
Chg (%)
(Pts)
(Close)
Dow Jones
(0.5)
(30)
23,271
Stocks in the U.K. closed lower on Wednesday, as a slide in oil prices pulled energy
producer shares into the red and a drop in metals prices knocked down prices for
Nasdaq
(0.4)
(20)
6,706
miners. The FTSE 100 dropped 0.6% to end at 7,372.
FTSE
(0.6)
(45)
7,372
Nikkei
(1.6)
(352)
22,028
On domestic front, Indices continue it’s down ward trend owing to Weak global cues
after a sharp fall in commodity prices, Disappointing earnings updates from the likes
Hang Seng
(1.0)
(300)
28,852
of Sun Pharma and Grasim as well as weak trade data. India's trade deficit widened
Shanghai Com
(0.8)
(27)
3,403
to an almost three-year high in October as exports declined for the first time in 14
months amid a liquidity crunch because of delayed GST refunds. The benchmark
Advances / Declines
BSE
NSE
BSE Sensex ended down 0.55% at 32,760, while the Nifty fell 0.7% to closed at
Advances
734
371
10,118.
Declines
1,999
1,389
News Analysis
Unchanged
103
56
New India Assurance Q2 profit almost triples to `748cr YoY
Detailed analysis on Pg2
Volumes (` Cr)
BSE
3,944
Investor’s Ready Reckoner
NSE
30,562
Key Domestic & Global Indicators
Stock Watch: Latest investment recommendations on 150+ stocks
Net Inflows (` Cr)
Net
Mtd
Ytd
Refer Pg5 onwards
FII
2,681
12,283
50,735
Top Picks
MFs
2,326
3,825
99,236
CMP
Target
Upside
Company
Sector
Rating
(`)
(`)
(%)
Top Gainers
Price (`)
Chg (%)
Blue Star
Capital Goods
Buy
698
760
8.9
Dewan Housing Finance
Financials
Accumulate
615
520
(15.5)
Religare
46
10.0
Asian Granito
Other
Buy
481
480
(0.2)
Fortis
140
7.7
Navkar Corporation
Other
Buy
183
265
44.9
Icil
120
7.1
KEI Industries
Capital Goods Accumulate
322
258
(19.8)
Biocon
392
6.6
More Top Picks on Pg4
Videoind
15
5.0
Key Upcoming Events
Previous
Consensus
Date
Region
Event Description
Top Losers
Price (`)
Chg (%)
Reading
Expectations
Nov16
Euro Zone Euro-Zone CPI (YoY)
1.40
1.40
Rcom
10
(12.1)
Nov16
US
Initial Jobless claims
239.00
235.00
Relcapital
423
(10.2)
Nov16
US
Industrial Production
0.28
0.50
Relinfra
417
(9.2)
Nov17
US
Existing home sales
5.39
5.41
Hindcopper
89
(8.6)
Nov17
US
Housing Starts
1,127.00
1,190.00
Rpower
35
(8.6)
More Events on Pg7
As on November, 14 2017
Market Outlook
November 16, 2017
News Analysis
New India Assurance Q2 profit almost triples to `748cr YoY
New India Assurance today reported 187.52 % jump in net profit for Q2FY18 due
to lower incurred claims loss and improvement combined ratio.
The company reported net profit of `748.27cr as against `260.24cr in the
corresponding quarter last year. It has investment portfolio of `61,000cr and had
earned 8% on the portfolio.
The company has declared an interim dividend of 75%. The dividend payout will
cost `300cr for the company.
The combined ratio came down to 112.57 % compared to 124.24 % a year ago,
the adjusted combined ratio for the quarter dropped to 91.45% as compared to
103.65% of the earlier year largely driven by improvement in claims ratio and
expenses of management ratio.
Economic and Political News
PSBs told to submit roadmap for fund-raising in a month.
India M&A to reach $46.5 billon in 2017
GST Council to take up moderation of rates for handicrafts, handloom
Corporate News
RBL Bank acquires an additional 2.08% stake in Swadhaar Finserve,
increasing its holding to 60.48%.
ONGC says Venezuela’s state-run PDVSA is committed to the arrangement
with ONGC Videsh.
Fortis proposes to buy RHT Health assets for ₹4,650cr
Market Outlook
November 16, 2017
Top Picks HHHHH
Market Cap
CMP
Target
Upside
Company
Rationale
(` Cr)
(`)
(`)
(%)
Strong growth in domestic business due to its leade`hip
in acute therapeutic segment. Alkem expects to launch
Alkem Laboratories
23,889
1,998
2,125
6.4
more products in USA, which bodes for its international
business.
We expect the company would report strong profitability
Asian Granito
1,446
481
570
18.6
owing to better product mix, higher B2C sales and
amalgamation synergy.
Favorable outlook for the AC industry to augur well for
Cooling products business which is out pacing the
Blue Star
6,690
698
867
24.2
market growth. EMPPAC division's profitability to
improve once operating environment turns around.
With a focus on the low and medium income (LMI)
consumer segment, the company has increased its
Dewan Housing Finance
19,301
615
712
15.7
presence in tier-II & III cities where the growth
opportunity is immense.
Loan growth is likely to pick up after a sluggish FY17.
Lower credit cost will help in strong bottom-line growth.
Karur Vysya Bank
7,264
120
180
49.8
Increasing share of CASA will help in NIM
improvement.
High order book execution in EPC segment, rising B2C
KEI Industries
2,520
322
380
18.2
sales and higher exports to boost the revenues and
profitability
Expected to benefit from the lower capex requirement
Music Broadcast
2,077
364
434
19.2
and 15 year long radio broadcast licensing.
Massive capacity expansion along with rail advantage
Navkar Corporation
2,752
183
265
44.9
at ICD as well CFS augur well for the company
Strong brands and distribution network would boost
Siyaram Silk Mills
2,640
563
650
15.4
growth going ahead. Stock currently trades at an
inexpensive valuation.
Market leadership in Hindi news genre and no.
2
viewership ranking in English news genre, exit from the
TV Today Network
2,099
352
435
23.6
radio business, and anticipated growth in ad spends by
corporate to benefit the stock.
After GST, the company is expected to see higher
volumes along with improving product mix. The Gujarat
Maruti Suzuki
2,45,377
8,123
8,890
9.4
plant will also enable higher operating leverage which
will be margin accretive.
We expect loan book to grow at 24.3% over next two
GIC Housing
2,256
419
655
56.3
year; change in borrowing mix will help in NIM
improvement..
Source: Company, Angel Research
Market Outlook
November 16, 2017
Key Upcoming Events
Global economic events release calendar
Bl oomberg Data
D ate
Time
C ountry
Event Description
Unit
Period
L ast Reporte d
E stimate d
Nov 16, 2017
3:30 PM Euro Zone
Euro-Zone CPI (YoY)
%
Oct F
1.40
1.40
7:00 PM US
Initial Jobless claims
Thousands
Nov 11
239.00
235.00
7:45 PM US
Industrial Production
%
Oct
0.28
0.50
Nov 17, 2017
8:30 PM US
Existing home sales
Million
Oct
5.39
5.41
7:00 PM US
Housi ng Starts
Thousands
Oct
1,127.00
1,190.00
Nov 21, 2017
7:00 PM US
Building permits
Thousands
Oct
1,225.00
1,250.00
Nov 22, 2017
8:30 PM Euro Zone
Euro-Zone Consumer Confidence
Value
Nov A
(1.00)
Nov 23, 2017
12: 30 PM Germany
GDP nsa (YoY)
% Change
3Q F
2.30
2:00 PM Germany
PMI Services
Value
Nov P
54.70
2:00 PM Germany
PMI Manufacturing
Value
Nov P
60.60
Nov 27, 2017
8:30 PM US
New home sales
Thousands
Oct
667.00
615.00
Nov 28, 2017
8:30 PM US
Consumer Confidence
S.A./ 1985=100
Nov
125.90
123.00
3:00 PM UK
GDP (YoY)
% Change
3Q P
1.50
Nov 29, 2017
7:00 PM US
GDP Qoq (Annualise d)
% Change
3Q S
3.00
3.40
Nov 30, 2017
2:25 PM Germany
Unempl oyment change (000's)
Thousands
Nov
(11.00)
3:00 PM UK
PMI Manufacturing
Value
Nov
56.30
Dec 01, 2017
6:30 AM China
PMI Manufacturing
Value
Nov
51.60
Dec 05, 2017
3:30 PM Euro Zone
Euro-Zone GDP s.a. (QoQ)
% Change
3Q F
0.60
Dec 06, 2017
2:30 PM India
RBI Reverse Re po rate
%
Dec 6
5.75
2:30 PM India
RBI Repo rate
%
Dec 6
6.00
2:30 PM India
RBI Cash Reserve ratio
%
Dec 6
4.00
Dec 08, 2017
India
Imports YoY%
% Change
Nov
7.60
India
Exports YoY%
% Change
Nov
(1.10)
3:00 PM UK
Industrial Production (YoY)
% Change
Oct
2.50
Source: Bloomberg, Angel Research
Market Outlook
November 16, 2017
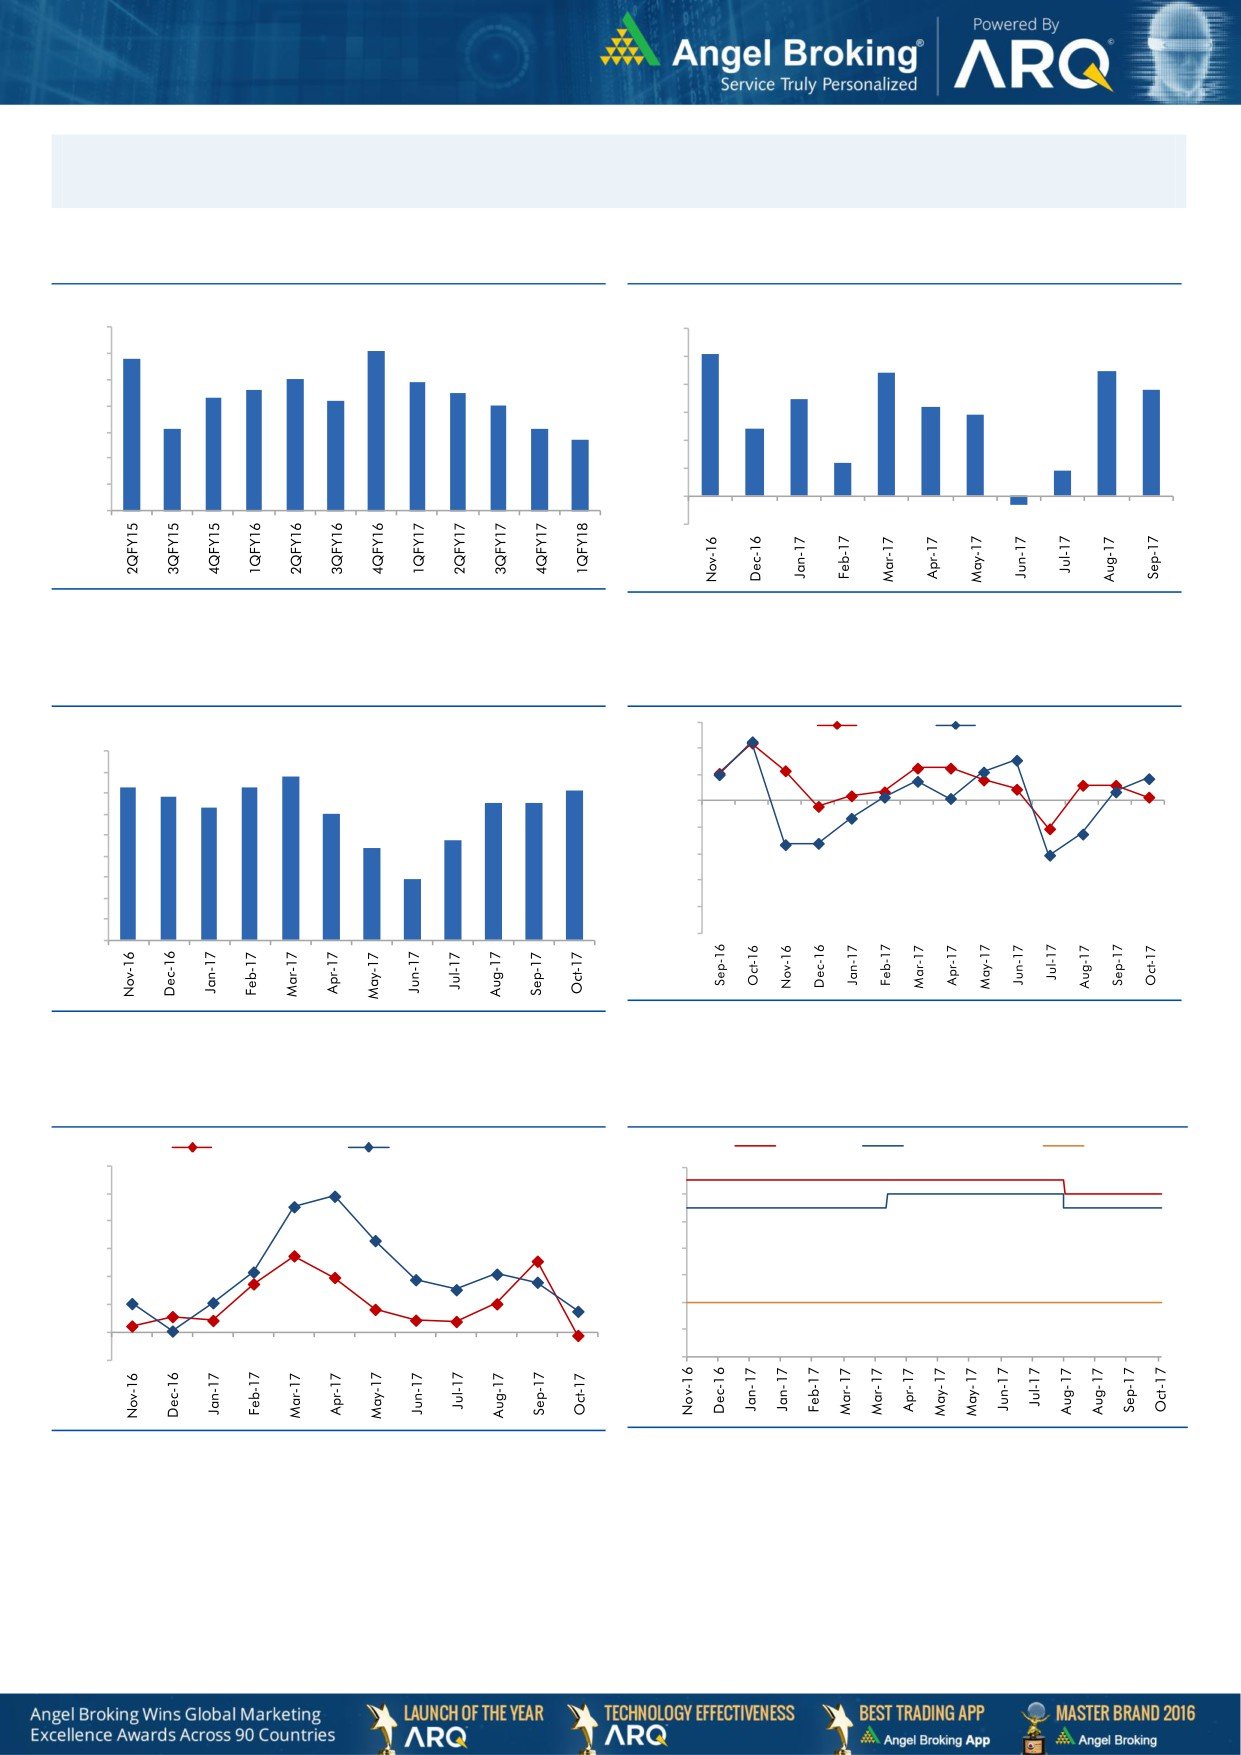
Macro watch
Exhibit 1: Quarterly GDP trends
Exhibit 2: IIP trends
(%)
(%)
10.0
6.0
9.1
5.1
8.8
9.0
5.0
4.4
4.5
8.0
7.9
7.6
7.5
3.8
8.0
7.3
7.2
4.0
3.5
7.0
3.2
2.9
7.0
6.1
6.1
3.0
2.4
5.7
6.0
2.0
1.2
5.0
0.9
1.0
4.0
-
3.0
(1.0)
(0.3)
Source: CSO, Angel Research
Source: MOSPI, Angel Research
Exhibit 3: Monthly CPI inflation trends
Exhibit 4: Manufacturing and services PMI
56.0
Mfg. PMI
Services PMI
(%)
4.5
54.0
3.9
4.0
3.6
3.7
3.6
52.0
3.4
3.2
3.3
3.3
3.5
3.0
50.0
3.0
2.4
48.0
2.5
2.2
2.0
46.0
1.5
1.5
44.0
1.0
42.0
0.5
40.0
-
Source: Market, Angel Research; Note: Level above 50 indicates expansion
Source: MOSPI, Angel Research
Exhibit 5: Exports and imports growth trends
Exhibit 6: Key policy rates
(%)
Exports yoy growth
Imports yoy growth
(%)
Repo rate
Reverse Repo rate
CRR
60.0
6.50
50.0
6.00
40.0
5.50
30.0
5.00
20.0
4.50
10.0
4.00
0.0
3.50
(10.0)
3.00
Source: Bloomberg, Angel Research
Source: RBI, Angel Research
Market Outlook
November 16, 2017
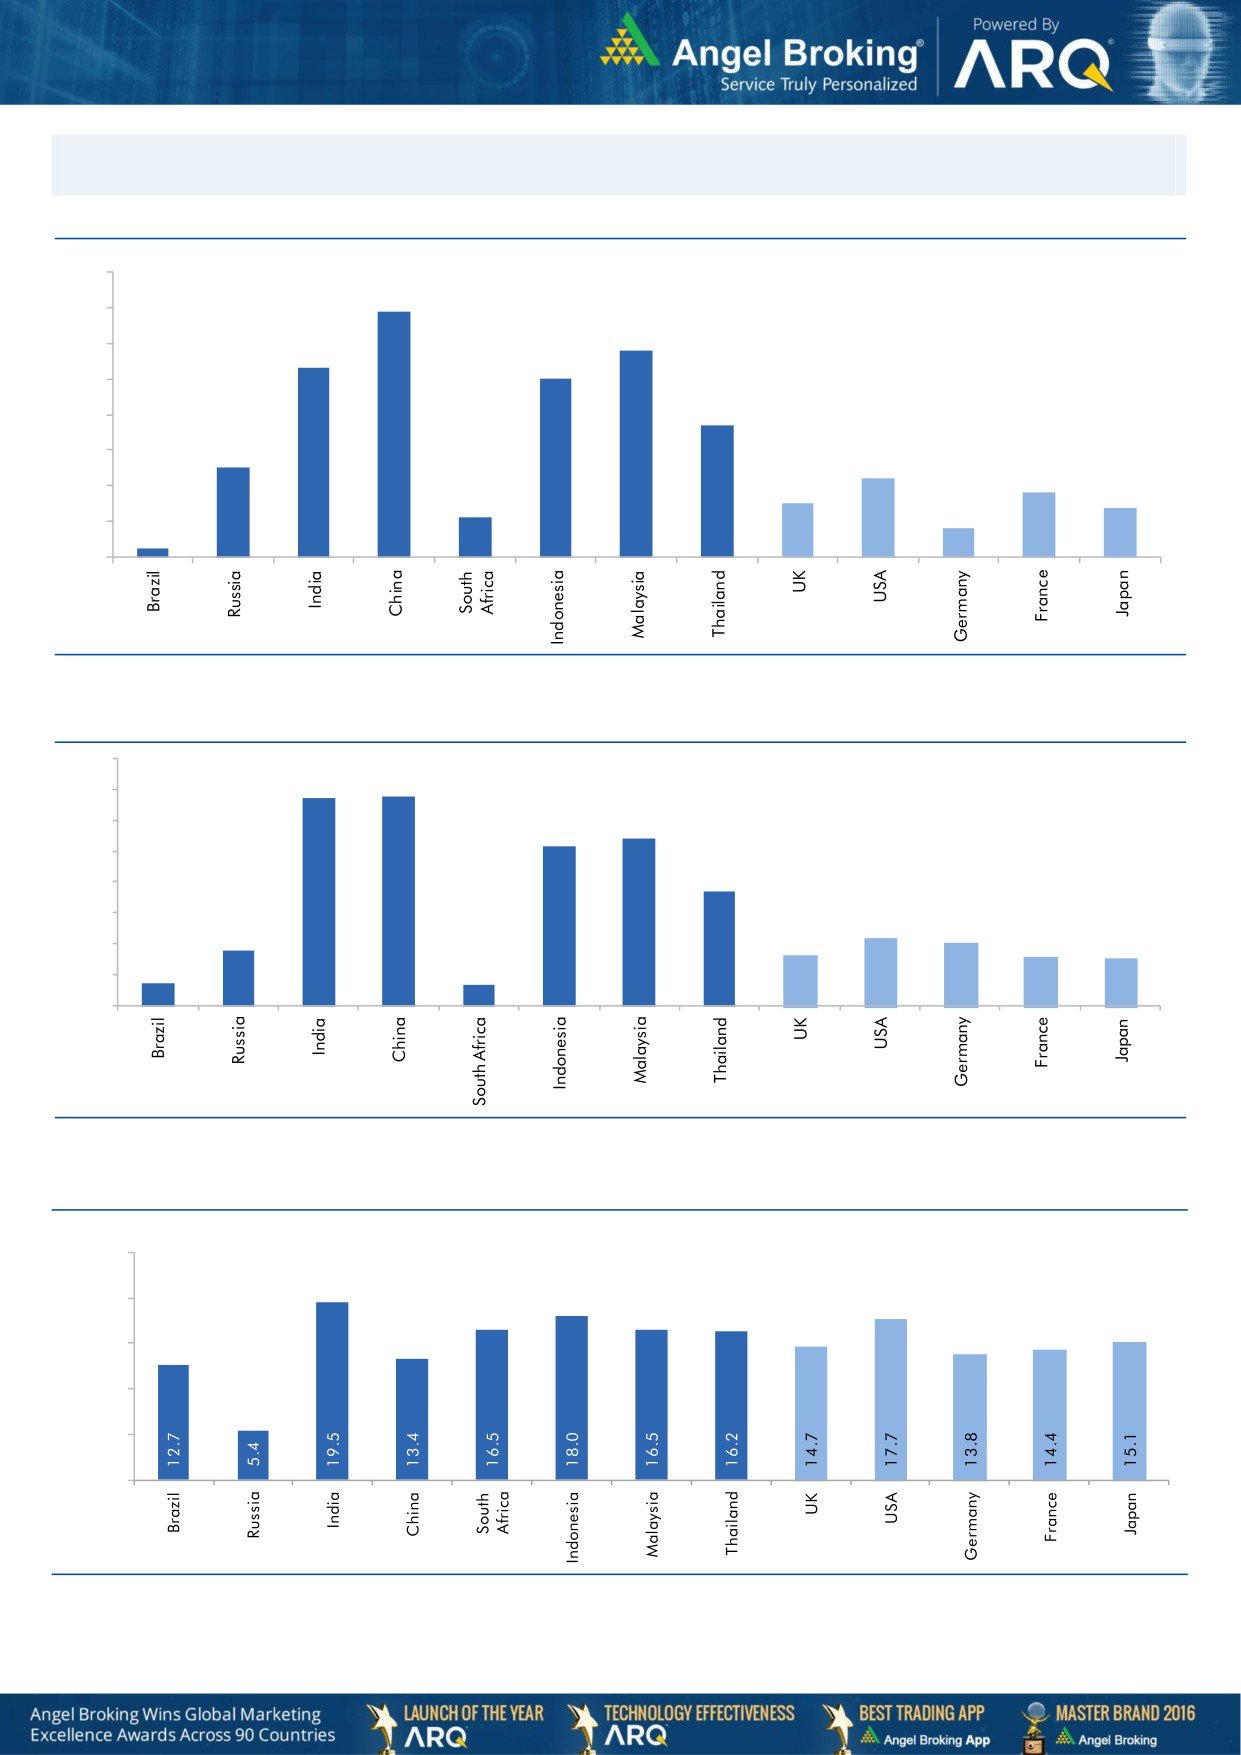
Global watch
Exhibit 1: Latest quarterly GDP Growth (%, yoy) across select developing and developed countries
(%)
8.0
6.9
7.0
5.8
6.0
5.3
5.0
5.0
1.1
3.7
4.0
2.5
3.0
2.2
1.8
2.0
1.5
1.4
0.8
1.0
0.3
-
Source: Bloomberg, Angel Research
Exhibit 2: 2017 GDP Growth projection by IMF (%, yoy) across select developing and developed countries
(%)
6.7
6.8
7.0
6.0
5.4
5.2
5.0
3.7
4.0
3.0
1.8
2.2
2.0
1.7
1.6
2.0
0.7
1.5
0.7
1.0
-
Source: IMF, Angel Research
Exhibit 3: One year forward P-E ratio across select developing and developed countries
(x)
25.0
20.0
15.0
10.0
5.0
-
Source: IMF, Angel Research
Market Outlook
November 16, 2017
Exhibit 4: Relative performance of indices across globe
Returns (%)
C ountry
Name of index
Closing price
1M
3M
1YR
Brazil
Bovespa
70,827
(7.6)
5.1
15.7
Russia
Micex
2,167
2.2
10.4
5.0
India
Nifty
10,187
(0.5)
4.2
22.0
China
Shanghai Composite
3,430
0.7
4.3
8.6
South Africa
Top 40
53,274
2.7
7.9
20.7
Mexico
Mexbol
47,874
(4.2)
(6.8)
6.6
Indonesia
LQ45
993
(0.0)
3.0
6.9
Malaysia
KLCI
1,734
(1.2)
(2.5)
5.2
Thailand
SET 50
1,084
(2.0)
8.0
14.6
USA
Dow Jones
23,409
2.4
6.4
23.7
UK
FTSE
7,414
(1.6)
0.4
9.8
Japan
Nikkei
22,380
6.8
13.4
30.3
Germany
DAX
13,033
(1.0)
5.6
20.6
France
CAC
5,316
(1.5)
2.7
16.7
Source: Bloomberg, Angel Research as on November 14, 2017 p68in4
Stock Watch
November 16, 2017
Company Name
Reco
CMP
Target
Mkt Cap
Sales ( Čcr )
OPM(%)
EPS (Č)
PER(x)
P/BV(x)
RoE(%)
EV/Sales(x)
(Č)
Price ( Č)
( Č cr )
FY18E FY19E
FY18E
FY19E
FY18E
FY19E
FY18E
FY19E
FY18E
FY19E
FY18E
FY19E
FY18E
FY19E
Agri / Agri Chemical
Rallis
Reduce
227
209
4,412
1,873
2,099
15.0
15.0
9.5
10.5
23.9
21.6
3.6
3.3
15.8
16.0
2.3
2.0
United Phosphorus
Accumulate
721
820
36,673
18,922
21,949
18.0
18.5
36.2
45.6
19.9
15.8
4.2
3.4
22.7
23.8
2.1
1.8
Auto & Auto Ancillary
Ashok Leyland
Accumulate
113
127
33,193
23,339
27,240
10.1
10.8
4.7
6.2
24.4
18.2
4.9
4.3
20.0
23.6
1.4
1.2
Bajaj Auto
Neutral
3,212
-
92,955
23,936
27,955
19.5
20.1
142.7
167.3
22.5
19.2
4.9
4.4
21.8
22.8
3.5
2.9
Bharat Forge
Buy
691
875
32,191
7,637
8,755
21.7
23.2
36.1
47.3
19.2
14.6
3.4
2.9
18.5
20.8
4.1
3.5
Eicher Motors
Neutral
30,483
-
82,983
19,043
22,837
19.5
19.9
835.4
1,019.0
36.5
29.9
13.6
10.5
40.9
37.8
4.2
3.5
Gabriel India
Neutral
193
-
2,775
1,782
2,033
9.7
10.2
7.1
8.9
27.2
21.8
5.5
4.6
21.0
22.2
1.5
1.3
Hero Motocorp
Accumulate
3,676
4,129
73,399
32,239
36,878
16.0
15.6
184.4
206.5
19.9
17.8
6.3
5.5
31.3
30.7
2.1
1.8
Jamna Auto Industries Neutral
60
-
2,377
1,441
1,662
14.4
14.8
13.9
17.6
4.3
3.4
1.2
1.0
30.0
31.0
1.6
1.4
Mahindra and Mahindra Neutral
1,415
-
87,940
46,971
53,816
13.6
14.0
67.7
79.8
20.9
17.7
3.0
2.7
15.0
15.9
1.8
1.5
Maruti
Accumulate
8,123
8,890
245,377
80,985
97,917
15.6
16.9
282.3
370.4
28.8
21.9
6.3
5.1
21.8
23.1
2.7
2.1
Minda Industries
Neutral
1,038
-
8,966
4,328
5,084
11.0
11.9
27.3
36.4
38.1
28.5
8.1
6.3
23.1
25.6
2.2
1.8
Motherson Sumi
Neutral
349
-
73,523
55,937
64,445
10.8
11.4
16.9
21.1
20.7
16.6
4.6
4.7
25.2
25.4
1.4
1.2
Tata Motors
Neutral
409
-
117,977
303,167
343,649
11.8
13.8
33.1
54.7
12.3
7.5
2.0
1.6
16.9
23.0
0.4
0.4
TVS Motor
Neutral
696
-
33,071
13,992
16,216
9.0
9.4
17.1
20.3
40.8
34.3
10.8
8.4
29.7
27.7
2.3
1.9
Amara Raja Batteries
Neutral
820
-
14,010
6,140
7,122
14.3
15.6
29.3
39.0
28.0
21.0
4.8
4.0
17.1
19.0
2.3
2.0
Exide Industries
Neutral
196
-
16,664
8,689
9,854
15.1
15.2
9.7
11.0
20.3
17.8
3.6
3.2
15.7
16.1
1.7
1.4
Apollo Tyres
Neutral
232
-
13,263
15,739
17,326
13.3
14.6
20.4
26.7
11.4
8.7
1.4
1.2
20.4
26.7
1.1
1.0
Ceat
Neutral
1,746
-
7,064
6,661
7,717
11.1
14.2
116.2
178.2
15.0
9.8
2.6
2.2
15.2
21.3
1.2
1.0
JK Tyres
Neutral
143
-
3,253
8,318
9,239
16.2
16.4
21.0
27.5
6.8
5.2
1.3
1.1
19.1
20.4
0.8
0.7
Swaraj Engines
Neutral
1,880
-
2,335
788
889
16.4
16.5
71.6
81.0
26.3
23.2
7.6
7.0
29.6
31.0
2.6
2.3
Subros
Neutral
244
-
1,462
1,855
2,135
11.6
11.8
10.3
14.7
23.8
16.6
3.6
3.1
15.8
19.1
1.0
0.9
Capital Goods
BEML
Neutral
1,654
-
6,888
4,286
5,194
7.1
8.2
42.9
58.1
38.6
28.5
3.2
2.9
7.6
8.7
1.7
1.3
Bharat Electronics
Neutral
176
-
43,329
10,258
12,470
19.6
19.5
7.3
8.6
24.2
20.5
0.5
0.4
20.4
21.9
3.7
3.0
Voltas
Neutral
584
-
19,314
6,778
8,004
9.6
11.0
17.1
22.4
34.1
26.1
8.1
7.1
17.7
19.8
2.5
2.1
BHEL
Neutral
88
-
32,400
33,200
39,167
6.8
9.5
6.2
11.2
14.2
7.9
0.7
0.6
4.6
8.0
0.6
0.4
Blue Star
Buy
698
867
6,690
5,220
6,207
6.3
6.6
16.8
22.3
41.5
31.3
8.3
7.3
19.9
23.3
1.2
1.0
CG Power and Industrial
Neutral
80
-
4,995
6,555
7,292
7.5
7.5
-
0.8
7,970.0
99.6
1.2
1.2
0.1
1.2
0.9
0.8
Solutions
Greaves Cotton
Neutral
121
-
2,959
1,778
1,993
14.7
15.1
8.1
9.1
15.0
13.3
3.4
3.1
21.8
23.6
1.4
1.3
Stock Watch
November 16, 2017
Company Name
Reco
CMP
Target
Mkt Cap
Sales ( Čcr )
OPM(%)
EPS (Č)
PER(x)
P/BV(x)
RoE(%)
EV/Sales(x)
(Č)
Price ( Č)
( Č cr )
FY18E FY19E
FY18E
FY19E
FY18E
FY19E
FY18E
FY19E
FY18E
FY19E
FY18E
FY19E
FY18E
FY19E
Capital Goods
KEC International
Buy
294
350
7,557
9,779
11,113
9.4
9.8
14.2
18.2
20.7
16.2
4.0
3.3
21.1
22.1
1.0
0.9
KEI Industries
Buy
322
380
2,520
3,001
3,391
10.0
10.0
13.0
16.1
24.7
20.0
4.5
3.7
18.2
18.7
1.0
0.9
Thermax
Neutral
996
-
11,872
4,125
4,747
10.3
10.8
26.7
31.5
37.3
31.6
4.2
3.8
11.2
12.0
2.6
2.3
VATech Wabag
Buy
534
681
2,915
3,867
4,126
9.6
10.0
34.9
39.8
15.3
13.4
2.5
2.2
17.7
17.5
0.8
0.7
Cement
ACC
Neutral
1,768
-
33,199
12,255
13,350
13.5
14.3
58.0
66.2
30.5
26.7
3.6
3.4
11.5
12.2
2.7
2.5
Ambuja Cements
Neutral
276
-
54,804
10,250
11,450
17.5
19.0
7.2
8.3
38.3
33.3
2.8
2.6
7.0
7.8
5.1
4.5
India Cements
Neutral
167
-
5,143
6,135
6,750
14.8
15.2
8.5
11.5
19.6
14.5
1.0
0.9
4.8
6.2
1.2
1.0
JK Cement
Neutral
1,054
-
7,370
4,150
4,775
19.2
20.0
49.0
63.5
21.5
16.6
3.4
2.9
17.0
18.5
2.2
1.9
J K Lakshmi Cement
Neutral
435
-
5,123
3,422
3,757
15.5
17.0
13.5
23.2
32.3
18.8
3.4
2.9
10.8
15.5
1.9
1.7
Orient Cement
Neutral
155
-
3,169
2,215
3,233
16.8
17.0
5.9
6.9
26.2
22.4
2.0
1.9
10.8
10.1
2.4
1.6
UltraTech Cement
Neutral
4,315
-
118,479
28,250
35,150
20.2
23.5
77.5
122.2
55.7
35.3
4.7
4.3
9.6
14.8
4.7
3.7
Construction
KNR Constructions
Neutral
256
-
3,598
1,846
2,203
14.5
14.5
12.1
13.7
21.2
18.8
1.2
1.0
17.5
16.7
2.0
1.7
Larsen & Toubro
Neutral
1,208
-
169,158
95,787
109,476
10.2
11.6
44.5
50.8
27.2
23.8
3.4
3.1
12.9
13.1
2.3
2.0
Gujarat Pipavav Port
Neutral
134
-
6,493
739
842
61.6
62.7
5.1
6.2
26.3
21.8
3.3
3.2
12.7
14.9
8.2
7.1
PNC Infratech
Neutral
171
-
4,398
2,040
2,935
13.0
13.0
6.4
9.0
26.8
19.1
0.7
0.6
9.7
12.2
2.2
1.6
Simplex Infra
Neutral
498
-
2,466
6,012
6,619
11.6
11.7
21.1
31.0
23.7
16.1
1.7
1.5
6.5
8.6
0.9
0.9
Sadbhav Engineering
Neutral
313
-
5,369
3,823
4,426
10.7
10.8
10.3
11.8
30.4
26.5
3.6
3.2
10.1
10.5
1.7
1.5
NBCC
Neutral
265
-
23,850
9,099
12,706
6.4
6.4
7.3
9.6
36.4
27.7
1.6
1.3
27.5
30.5
2.5
1.8
MEP Infra
Neutral
102
-
1,666
2,403
2,910
18.3
16.8
2.4
6.1
43.6
16.9
16.5
11.1
35.2
55.8
1.9
1.5
SIPL
Neutral
121
-
4,253
2,060
2,390
46.8
47.7
(5.8)
(3.1)
4.5
5.2
(14.2)
(2.3)
6.8
6.4
Engineers India
Neutral
182
-
12,238
1,795
2,611
21.1
22.4
5.9
8.1
30.8
22.4
2.2
2.1
12.9
16.1
5.2
3.4
Financials
Axis Bank
Accumulate
542
580
129,999
32,558
35,843
3.5
3.2
27.8
41.0
19.5
13.2
2.1
1.9
11.4
14.9
-
-
Bank of Baroda
Neutral
175
-
40,208
22,533
26,079
2.4
2.4
12.0
20.9
14.5
8.4
0.9
0.9
6.6
11.0
-
-
Canara Bank
Neutral
370
-
22,100
17,925
20,235
2.0
2.1
18.5
36.5
20.0
10.1
0.8
0.7
3.4
6.2
-
-
Can Fin Homes
Accumulate
437
470
5,819
586
741
3.5
3.5
107.8
141.0
4.1
3.1
0.9
0.7
24.1
25.6
-
-
Cholamandalam Inv. &
Neutral
1,249
-
19,527
2,826
3,307
6.3
6.3
53.7
64.6
23.3
19.4
4.0
3.4
18.3
18.9
-
-
Fin. Co.
Dewan Housing Finance Buy
615
712
19,301
2,676
3,383
2.4
2.7
37.4
49.7
16.5
12.4
2.2
1.9
13.8
16.2
-
-
Equitas Holdings
Buy
138
235
4,690
1,125
1,380
9.6
9.8
1.5
6.0
92.1
23.0
2.1
2.0
2.4
8.2
-
-
Federal Bank
Accumulate
111
125
21,634
4,896
5,930
2.8
3.1
5.4
7.6
20.6
14.6
1.8
1.6
8.5
11.0
-
-
Stock Watch
November 16, 2017
Company Name
Reco
CMP
Target
Mkt Cap
Sales ( Čcr )
OPM(%)
EPS (Č)
PER(x)
P/BV(x)
RoE(%)
EV/Sales(x)
(Č)
Price ( Č)
( Č cr )
FY18E FY19E
FY18E
FY19E
FY18E
FY19E
FY18E
FY19E
FY18E
FY19E
FY18E
FY19E
FY18E
FY19E
Financials
GIC Housing
Buy
419
655
2,256
376
477
3.6
3.7
33.0
40.0
12.7
10.5
2.3
1.9
20.0
23.0
-
-
HDFC Bank
Neutral
1,799
-
465,166
55,236
63,253
4.5
4.4
68.9
82.4
26.1
21.8
4.6
3.8
18.7
18.5
-
-
ICICI Bank
Neutral
316
-
202,531
42,361
51,378
3.6
3.9
18.4
25.7
17.2
12.3
1.9
1.8
11.3
15.0
-
-
Karur Vysya Bank
Buy
120
180
7,264
3,289
3,630
3.7
3.9
10.8
14.1
11.1
8.5
1.3
1.2
12.5
14.7
-
-
LIC Housing Finance
Accumulate
578
630
29,187
4,895
6,332
3.4
3.7
50.7
66.8
11.4
8.7
2.3
1.9
21.7
23.8
-
-
Punjab Natl.Bank
Neutral
181
-
38,442
23,708
25,758
2.1
2.1
5.9
16.4
30.7
11.0
0.9
0.9
3.0
8.3
-
-
RBL Bank
Neutral
507
-
21,112
2,309
2,888
2.6
2.5
16.4
19.1
31.0
26.6
3.9
3.5
13.3
13.8
-
-
Repco Home Finance
Buy
614
825
3,843
496
597
4.4
4.2
38.5
48.7
16.0
12.6
2.9
2.4
19.6
20.6
-
-
South Ind.Bank
Neutral
30
-
5,422
3,195
3,567
3.0
3.1
3.0
3.8
10.0
7.8
1.0
0.9
10.5
11.9
-
-
St Bk of India
Neutral
325
-
280,714
105,827
121,056
2.4
2.5
16.1
25.6
20.2
12.7
1.6
1.4
6.6
9.9
-
-
Union Bank
Neutral
164
-
11,939
14,650
16,225
2.3
2.3
23.1
32.5
7.1
5.1
0.5
0.5
7.1
9.2
-
-
Yes Bank
Neutral
301
-
69,041
11,088
13,138
3.0
2.9
84.0
99.3
3.6
3.0
0.6
0.5
16.3
16.8
-
-
FMCG
Akzo Nobel India
Neutral
1,755
-
8,417
3,164
3,607
13.8
13.7
58.6
67.9
30.0
25.8
7.4
6.5
24.5
25.1
2.5
2.2
Asian Paints
Neutral
1,177
-
112,883
17,603
20,615
18.6
18.6
2,128.9
2,543.3
0.6
0.5
11.7
9.8
28.0
28.9
6.2
5.2
Britannia
Neutral
4,741
-
56,918
9,690
11,278
14.8
15.4
84.0
101.0
56.4
46.9
20.6
16.4
40.6
39.0
5.8
5.0
Colgate
Neutral
1,043
-
28,355
4,420
5,074
24.9
25.3
28.6
32.8
36.5
31.8
14.4
11.6
43.8
40.5
6.2
5.3
Dabur India
Neutral
335
-
58,949
8,346
9,344
19.6
19.9
7.8
9.0
42.9
37.2
8.7
7.8
25.2
24.8
6.7
5.9
GlaxoSmith Con*
Neutral
5,993
-
25,205
5,072
5,760
18.2
18.4
176.3
199.2
34.0
30.1
7.2
6.5
21.2
21.7
4.3
3.7
Godrej Consumer
Neutral
918
-
62,546
10,171
11,682
20.8
21.5
21.7
27.1
42.3
33.9
9.5
8.2
22.3
23.4
6.3
5.4
HUL
Neutral
1,265
-
273,763
37,077
41,508
20.3
21.8
5,189.9
6,318.5
0.2
0.2
38.6
32.9
74.8
82.0
7.2
6.5
ITC
Neutral
253
-
308,050
44,588
49,853
37.0
37.3
9.6
11.0
26.3
23.0
6.5
6.2
25.1
27.3
6.4
5.7
Marico
Neutral
291
-
37,536
6,788
7,766
18.5
19.2
7.1
8.5
41.0
34.2
14.3
12.3
36.9
38.0
5.4
4.7
Nestle*
Neutral
7,705
-
74,285
10,083
11,182
20.0
20.9
119.7
141.3
64.4
54.5
226.9
207.3
36.7
39.8
7.0
6.3
Tata Global
Neutral
251
-
15,835
7,121
7,641
11.9
12.3
6.9
8.0
36.4
31.4
2.4
2.3
6.8
7.2
2.0
1.9
Procter & Gamble
Neutral
8,919
-
28,952
3,034
3,579
27.1
27.7
167.7
198.8
53.2
44.9
14.3
12.3
28.8
29.5
9.0
7.5
Hygiene
IT
HCL Tech^
Buy
848
1,014
121,059
50,009
54,608
22.1
22.1
62.8
67.6
13.5
12.6
3.0
2.6
22.4
20.6
2.1
1.8
Infosys
Buy
952
1,120
218,662
70,333
75,960
26.0
26.0
61.7
65.9
15.4
14.5
2.9
2.7
18.9
18.7
2.5
2.3
TCS
Neutral
2,706
-
518,035
123,384
134,488
26.1
26.1
133.2
143.7
20.3
18.8
5.6
5.2
27.6
27.8
3.9
3.5
Tech Mahindra
Accumulate
495
533
48,355
31,015
33,496
15.0
15.0
35.6
38.1
13.9
13.0
2.4
2.2
17.0
16.3
1.3
1.2
Stock Watch
November 16, 2017
Company Name
Reco
CMP
Target
Mkt Cap
Sales ( Čcr )
OPM(%)
EPS (Č)
PER(x)
P/BV(x)
RoE(%)
EV/Sales(x)
(Č)
Price ( Č)
( Č cr )
FY18E FY19E
FY18E
FY19E
FY18E
FY19E
FY18E
FY19E
FY18E
FY19E
FY18E
FY19E
FY18E
FY19E
IT
Wipro
Neutral
296
-
144,151
54,164
56,544
22.3
22.3
18.8
19.5
15.8
15.2
2.5
2.2
15.0
13.6
1.9
1.7
Media
D B Corp
Neutral
361
-
6,643
2,404
2,625
30.5
31.5
23.7
26.9
15.2
13.4
3.6
3.1
23.5
22.8
2.6
2.4
HT Media
Neutral
96
-
2,229
2,589
2,830
15.1
15.4
8.3
10.9
11.5
8.8
0.9
0.9
8.4
10.4
0.4
0.3
Jagran Prakashan
Buy
163
225
5,317
2,541
2,835
28.5
28.7
12.7
14.1
12.8
11.5
2.7
2.3
21.3
21.4
1.9
1.7
Sun TV Network
Neutral
834
-
32,849
3,238
3,789
51.9
55.1
30.9
38.0
27.0
21.9
7.7
6.8
30.0
31.0
9.7
8.1
Hindustan Media
Neutral
245
-
1,797
1,002
1,074
23.3
23.5
29.2
33.8
8.4
7.2
1.3
1.1
15.6
15.4
0.8
0.5
Ventures
TV Today Network
Buy
352
435
2,099
667
727
27.7
27.7
18.6
20.1
18.9
17.5
2.9
3.0
15.6
17.3
2.7
2.5
Music Broadcast Limited Buy
364
434
2,077
271
317
91.0
109.0
6.0
10.0
60.7
36.4
3.8
3.4
6.5
9.3
7.3
6.0
Metals & Mining
Coal India
Neutral
272
-
169,090
82,301
91,235
17.0
18.0
17.1
20.5
15.9
13.3
3.0
2.8
45.0
55.0
1.7
1.5
Hind. Zinc
Neutral
296
-
125,260
22,108
24,555
57.0
58.0
22.1
26.3
13.4
11.3
4.4
3.5
32.0
35.0
4.7
3.9
Hindalco
Neutral
252
-
56,546
102,350
105,355
13.5
14.5
21.5
24.5
11.7
10.3
1.6
1.4
15.0
15.2
1.1
1.1
JSW Steel
Neutral
256
-
61,796
64,500
68,245
21.1
21.5
20.1
21.2
12.7
12.1
2.3
2.0
-
-
1.7
1.6
NMDC
Neutral
122
-
38,694
10,209
11,450
47.0
48.0
11.1
12.1
11.0
10.1
1.5
1.4
-
-
3.3
3.0
SAIL
Neutral
76
-
31,347
54,100
63,555
3.0
10.0
(10.0)
1.5
50.6
1.0
1.0
-
-
1.6
1.3
Vedanta
Neutral
296
-
109,843
81,206
87,345
28.0
29.0
26.5
33.5
11.2
8.8
2.5
2.2
-
-
2.1
1.8
Tata Steel
Neutral
678
-
65,853
121,445
126,500
16.2
17.2
65.4
81.3
10.4
8.4
1.7
1.4
-
-
1.1
0.9
Oil & Gas
GAIL
Neutral
449
-
75,880
53,115
52,344
14.2
15.3
30.0
31.1
15.0
14.4
1.9
1.7
-
-
1.2
1.1
ONGC
Neutral
177
-
227,598
83,111
84,934
44.2
44.9
16.4
16.9
10.8
10.5
1.3
1.2
-
-
2.6
2.6
Indian Oil Corp
Neutral
389
-
189,065
396,116
432,560
8.5
8.8
40.1
42.2
9.7
9.2
1.7
1.5
-
-
0.6
0.6
Reliance Industries
Neutral
882
-
573,895
257,711
267,438
17.0
18.2
89.1
89.5
9.9
9.9
0.9
0.9
-
-
1.9
1.8
Pharmaceuticals
Alembic Pharma
Buy
513
600
9,674
3,903
4,584
18.2
19.2
21.8
27.2
23.5
18.9
4.3
3.6
19.8
20.6
2.5
2.1
Alkem Laboratories Ltd
Accumulate
1,998
2,125
23,889
6,320
7,341
17.5
19.8
72.7
96.6
27.5
20.7
4.9
4.1
16.7
18.7
3.7
3.1
Aurobindo Pharma
Buy
696
823
40,757
17,086
19,478
22.1
22.0
44.7
51.4
15.6
13.5
3.5
2.8
24.7
22.7
2.5
2.2
Aventis*
Neutral
4,352
-
10,022
2,508
2,862
16.8
16.8
139.9
153.8
31.1
28.3
4.5
3.7
23.5
25.8
3.6
3.0
Cadila Healthcare
Neutral
439
-
44,978
11,584
13,228
20.3
20.4
18.7
21.3
23.5
20.6
5.2
4.3
24.6
22.9
3.7
3.2
Cipla
Sell
594
458
47,767
16,619
19,437
15.4
16.2
19.7
24.3
30.1
24.4
3.4
3.0
12.0
13.2
3.0
2.6
Dr Reddy's
Neutral
2,307
-
38,257
15,844
17,973
17.6
18.2
91.7
111.0
25.2
20.8
2.9
2.6
11.9
13.0
2.6
2.3
GSK Pharma*
Neutral
2,551
-
21,609
3,260
3,651
15.0
18.0
46.1
58.6
55.3
43.5
11.4
11.7
20.0
26.5
6.5
5.9
Indoco Remedies
Sell
273
153
2,513
1,154
1,310
14.9
14.9
11.3
12.7
24.1
21.5
3.4
3.0
15.0
15.0
2.3
2.0
Stock Watch
November 16, 2017
Company Name
Reco
CMP
Target
Mkt Cap
Sales ( Čcr )
OPM(%)
EPS (Č)
PER(x)
P/BV(x)
RoE(%)
EV/Sales(x)
(Č)
Price ( Č)
( Č cr )
FY18E FY19E
FY18E
FY19E
FY18E
FY19E
FY18E
FY19E
FY18E
FY19E
FY18E
FY19E
FY18E
FY19E
Pharmaceuticals
Ipca labs
Neutral
526
-
6,641
3,593
4,022
14.5
15.5
19.4
25.2
27.1
20.9
2.5
2.2
9.5
11.2
1.9
1.7
Lupin
Buy
823
1,467
37,174
18,657
21,289
21.3
23.3
52.8
66.7
15.6
12.3
2.4
2.0
16.3
17.5
2.0
1.6
Natco Pharma
Buy
905
1,057
15,783
1,886
2,016
32.3
29.5
23.2
22.0
39.1
41.0
8.2
7.2
20.9
17.6
8.2
7.7
Sun Pharma
Accumulate
505
558
121,174
32,899
36,451
26.9
25.4
31.6
32.3
16.0
15.6
2.8
2.4
18.7
18.8
3.3
2.8
Syngene International
Accumulate
508
556
10,168
1,394
1,818
33.0
36.0
15.8
20.6
32.1
24.7
6.0
4.9
18.6
20.0
7.3
5.6
Power
Tata Power
Neutral
82
-
22,193
32,547
33,806
20.5
20.5
4.7
5.4
17.5
15.3
1.7
1.4
10.5
10.5
1.7
1.6
NTPC
Neutral
174
-
143,430
86,070
101,246
28.3
30.7
12.9
16.2
13.5
10.7
1.4
1.3
10.6
12.4
3.0
2.7
Power Grid
Accumulate
207
223
108,346
29,183
32,946
89.7
90.0
18.0
20.8
11.5
10.0
1.9
1.7
17.7
18.2
7.6
7.1
Real Estate
Prestige Estate
Neutral
283
-
10,620
4,607
5,146
21.0
22.2
7.9
9.8
35.9
28.9
2.2
2.1
10.3
12.0
3.5
3.2
MLIFE
Buy
429
522
2,201
487
590
12.3
17.8
21.0
31.2
20.4
13.8
1.1
1.0
5.2
7.4
3.2
2.6
Telecom
Bharti Airtel
Neutral
487
-
194,813
97,903
105,233
36.0
36.3
9.3
11.1
52.4
44.1
2.5
2.4
5.0
5.6
2.9
2.7
Idea Cellular
Neutral
94
-
33,728
35,012
37,689
27.1
27.7
(4.4)
(2.7)
1.5
1.5
(6.8)
(4.6)
2.3
2.0
zOthers
Abbott India
Neutral
4,956
-
10,531
3,244
3,723
14.9
16.1
167.5
209.4
29.6
23.7
6.5
5.5
23.7
24.8
2.9
2.4
Asian Granito
Buy
481
570
1,446
1,169
1,286
12.5
12.5
16.0
19.7
30.1
24.4
3.2
2.8
10.7
11.6
1.5
1.3
Bajaj Electricals
Neutral
404
-
4,106
4,646
5,301
6.7
7.6
16.1
22.3
25.1
18.1
4.1
3.5
16.4
19.2
0.9
0.8
Banco Products (India)
Neutral
221
-
1,580
1,530
1,695
13.2
12.7
19.0
20.0
11.6
11.1
1.9
1.6
0.2
0.2
0.9
104.8
Coffee Day Enterprises
Neutral
219
-
4,503
3,494
3,913
17.4
18.0
4.8
5.7
-
38.4
1.9
1.8
-
0.1
1.8
1.5
Ltd
Elecon Engineering
Neutral
70
-
786
171
201
15.0
16.2
36.0
43.0
2.0
1.6
0.2
0.2
0.1
0.1
4.0
3.4
Garware Wall Ropes
Neutral
915
-
2,002
928
1,003
15.2
15.2
39.4
43.2
23.2
21.2
3.8
3.3
16.5
15.4
2.0
1.8
Goodyear India*
Neutral
813
-
1,874
1,717
1,866
11.8
12.3
47.9
49.8
17.0
16.3
2.6
2.3
15.6
15.7
0.8
112.6
Hitachi
Neutral
2,400
-
6,525
2,355
2,715
10.3
10.8
49.0
60.9
49.0
39.4
11.5
9.1
0.2
0.2
2.8
2.4
HSIL
Neutral
457
-
3,307
2,240
2,670
14.6
15.0
17.0
22.0
26.9
20.8
2.2
2.1
0.1
0.1
1.7
1.4
Interglobe Aviation
Neutral
1,166
-
44,769
22,570
27,955
14.2
15.0
63.6
81.8
18.3
14.3
9.7
8.2
0.5
0.6
1.7
1.3
Jyothy Laboratories
Neutral
331
-
6,010
1,781
2,044
14.1
15.0
9.4
10.5
35.4
31.5
7.5
7.1
0.2
0.2
3.6
3.1
Linc Pen & Plastics
Neutral
242
-
358
420
462
9.3
9.3
15.3
17.1
15.8
14.1
2.7
2.8
16.9
19.5
0.9
0.8
M M Forgings
Neutral
860
-
1,038
542
642
20.1
21.0
41.6
56.8
20.7
15.1
2.9
2.4
0.1
0.2
2.3
2.0
Mirza International
Neutral
152
-
1,823
1,148
1,285
18.0
18.0
8.0
9.4
18.9
16.2
3.1
2.6
16.3
16.1
1.7
1.5
Navkar Corporation
Buy
183
265
2,752
561
617
41.5
41.5
11.5
12.7
15.9
14.4
1.7
1.5
10.5
10.4
5.6
4.9
Nilkamal
Neutral
1,561
-
2,329
2,317
2,525
11.4
11.1
96.0
105.0
16.3
14.9
2.8
2.4
0.2
0.2
1.0
0.9
Stock Watch
November 16, 2017
Company Name
Reco
CMP
Target Mkt Cap
Sales ( Čcr )
OPM(%)
EPS (Č)
PER(x)
P/BV(x)
RoE(%)
EV/Sales(x)
(Č)
Price ( Č)
( Č cr )
FY18E FY19E FY18E FY19E FY18E FY19E FY18E FY19E FY18E FY19E FY18E FY19E FY18E FY19E
zOthers
Parag Milk Foods
Neutral
233
-
1,959
1,987
2,379
7.6
9.0
12.4
18.3
18.8
12.7
2.6
2.3
8.2
13.2
1.1
0.9
Radico Khaitan
Neutral
219
-
2,911
1,811
1,992
13.2
13.2
8.1
8.8
27.0
24.8
2.7
3.0
10.1
12.0
1.9
1.8
Relaxo Footwears
Neutral
558
-
6,697
1,981
2,310
13.7
14.5
12.0
15.5
46.5
36.0
9.1
7.3
0.2
0.2
3.4
3.0
Siyaram Silk Mills
Buy
563
650
2,640
1,769
1,981
12.7
12.7
22.6
26.2
24.9
21.5
3.9
3.3
15.5
15.5
1.7
1.5
Styrolution ABS India* Neutral
932
-
1,638
1,800
1,980
8.0
8.1
42.0
46.2
22.2
20.2
2.5
2.2
0.1
0.1
1.0
0.9
Surya Roshni
Neutral
342
-
1,499
4,870
5,320
7.7
7.8
22.8
28.1
15.0
12.2
2.0
1.7
0.1
0.1
0.5
0.5
TVS Srichakra
Neutral
3,263
-
2,498
2,729
2,893
12.7
12.5
248.5
265.0
13.1
12.3
3.7
3.0
0.3
0.3
0.9
0.9
Visaka Industries
Neutral
620
-
984
1,104
1,214
12.1
12.6
31.0
37.9
20.0
16.4
2.4
2.2
0.1
0.1
1.1
1.0
VIP Industries
Neutral
305
-
4,307
1,450
1,693
10.4
10.5
6.5
7.8
46.6
39.0
9.8
8.6
21.1
22.1
3.0
2.5
Navin Fluorine
Accumulate
693
730
3,418
945
1,154
22.4
22.6
28.7
34.8
24.2
20.0
4.0
3.4
-
-
3.1
2.5
Source: Company, Angel Research; Note: *December year end; #September year end; &October year end; Price as on November 15, 2017
Market Outlook
November 16, 2017
Research Team Tel: 022 - 39357800
DISCLAIMER
Angel Broking Private Limited (hereinafter referred to as “Angel”) is a registered Member of National Stock Exchange of India
Limited,Bombay Stock Exchange Limited and Metropolitan Stock Exchange Limited. It is also registered as a Depository Participant with
CDSL and Portfolio Manager with SEBI. It also has registration with AMFI as a Mutual Fund Distributor. Angel Broking Private Limited is a
registered entity with SEBI for Research Analyst in terms of SEBI (Research Analyst) Regulations, 2014 vide registration number
INH000000164. Angel or its associates has not been debarred/ suspended by SEBI or any other regulatory authority for accessing
/dealing in securities Market. Angel or its associates/analyst has not received any compensation / managed or
co-managed public offering of securities of the company covered by Analyst during the past twelve months.
This document is solely for the personal information of the recipient, and must not be singularly used as the basis of any investment
decision. Nothing in this document should be construed as investment or financial advice. Each recipient of this document should make
such investigations as they deem necessary to arrive at an independent evaluation of an investment in the securities of the companies
referred to in this document (including the merits and risks involved), and should consult their own advisors to determine the merits and
risks of such an investment.
Reports based on technical and derivative analysis center on studying charts of a stock's price movement, outstanding positions and
trading volume, as opposed to focusing on a company's fundamentals and, as such, may not match with a report on a company's
fundamentals. Investors are advised to refer the Fundamental and Technical Research Reports available on our website to evaluate the
contrary view, if any.
The information in this document has been printed on the basis of publicly available information, internal data and other reliable
sources believed to be true, but we do not represent that it is accurate or complete and it should not be relied on as such, as this
document is for general guidance only. Angel Broking Pvt. Limited or any of its affiliates/ group companies shall not be in any way
responsible for any loss or damage that may arise to any person from any inadvertent error in the information contained in this report.
Angel Broking Pvt. Limited has not independently verified all the information contained within this document. Accordingly, we cannot
testify, nor make any representation or warranty, express or implied, to the accuracy, contents or data contained within this document.
While Angel Broking Pvt. Limited endeavors to update on a reasonable basis the information discussed in this material, there may be
regulatory, compliance, or other reasons that prevent us from doing so.
This document is being supplied to you solely for your information, and its contents, information or data may not be reproduced,
redistributed or passed on, directly or indirectly.
Neither Angel Broking Pvt. Limited, nor its directors, employees or affiliates shall be liable for any loss or damage that may arise from
or in connection with the use of this information.